ASM Profiler - Introduction to Sampling Mode
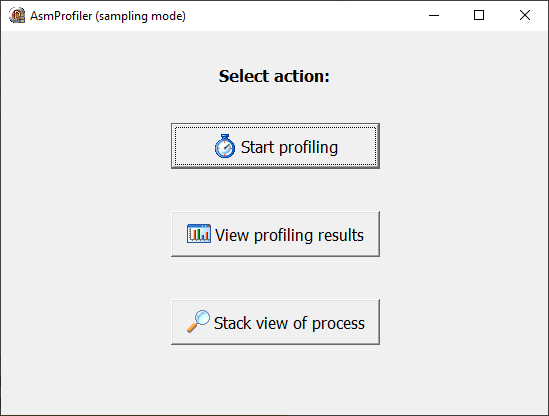
start profiling using the general workflow:
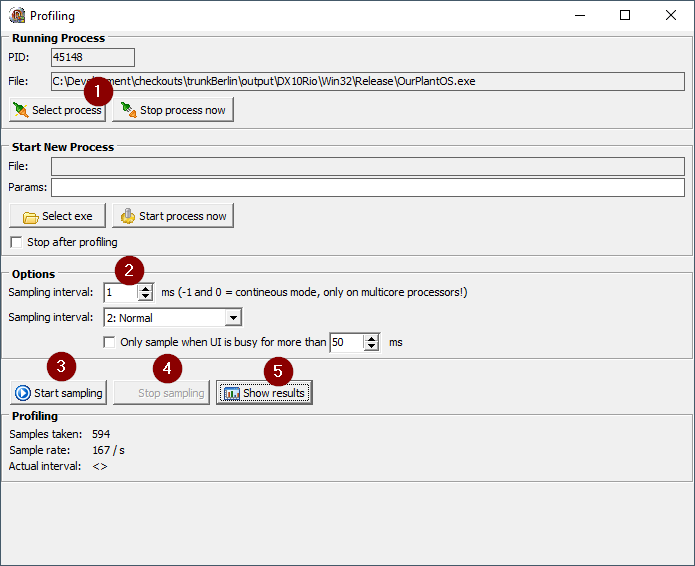
- select the process (You need the corresponding
.map-file of your application in the same directory where the.exefile is located. The.mapfile has to have the same filename like the.exefile:example_application.exe→example_application.map.) - change the sampling interval to your needs (for first experiences 1 ms is fine)
- start sampling (the more samples the more your CPU will calculate)
- stop it
- show results
Results overview
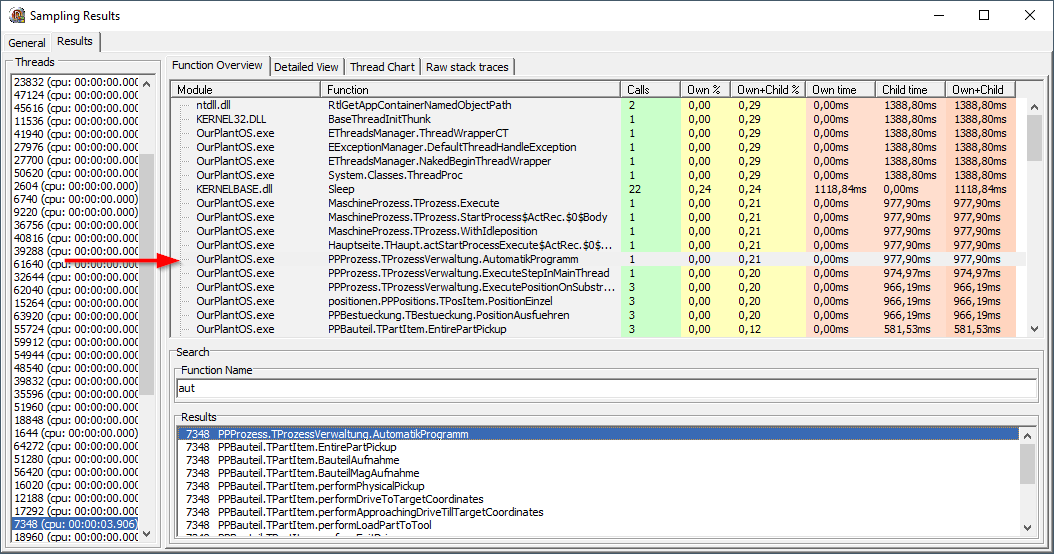
Find the method of your interest by using the Search Function Field. Type the function name and in the listbox above appear the filtered function. Push arrow down and enter the listbox. By selecting a line the treeview above will be updated and the selected function highlighted (shown by the red arrow in the picture).
By pressing return or double click in the results listbox or overview treeview you can get to the detailed view
results detailed view
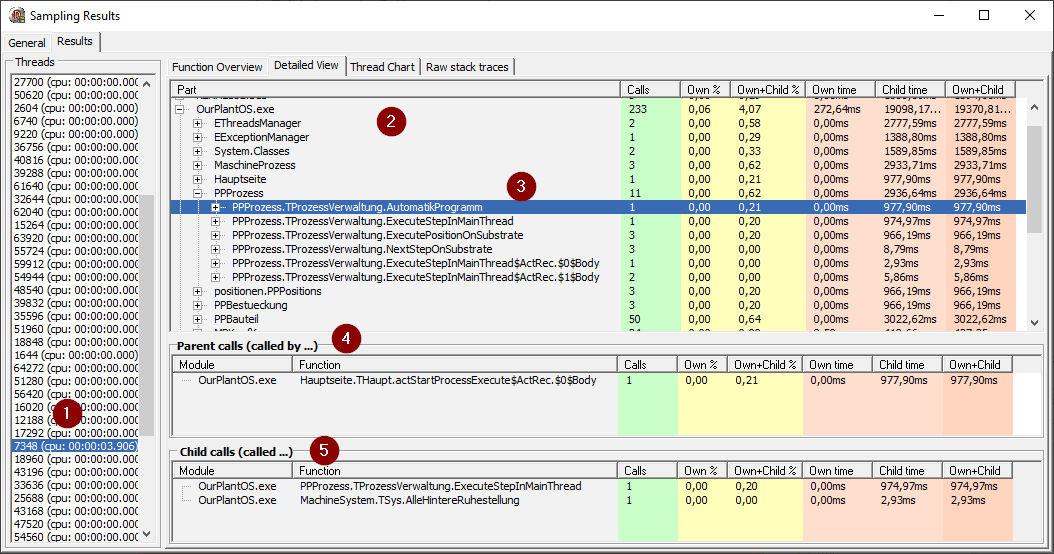
- selected thread
- tree view of all methods captured in the selected thread
- selected method
- list of the parents (these methods call the selected method)
- list of child methods called by the selected method
calls and times of detailed view
The Resolution of the time slices always depend on the sampling rate!
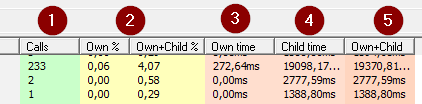
- be carefull with
callsin the SampleMode: the profiler is taking snapshots and the accuracy depends on the duration of the examined method and the sampling rate. It's just a "more or less" value - I'm not exactly shure what these values provide
- that's the time spent in the method - normally it's 0
- sum of all child times called by this method
- total time
In the parent and child section of this view the child times are the sum of time slices called by (parent section) or called (child section)
Example
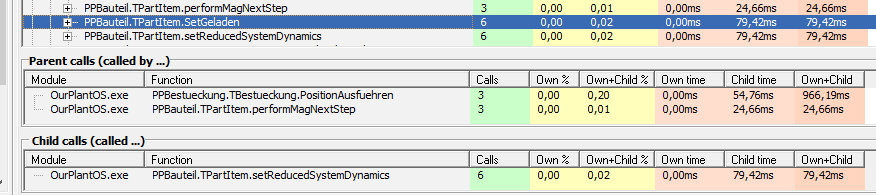
The method setGeladen has a total time of 79,42 ms and was called 6 times in total.
It was called 3 times from PositionAusfuehren and 3 times from performMagNextStep. The Own and Child time of PositionAusfuehren (966,19 ms) is the total time of this method. The Child time (54,76 ms) describes the time of the calls from this parent.
Raw stack traces
from the overview tab you can select a method an click right and select "show raw stack traces".
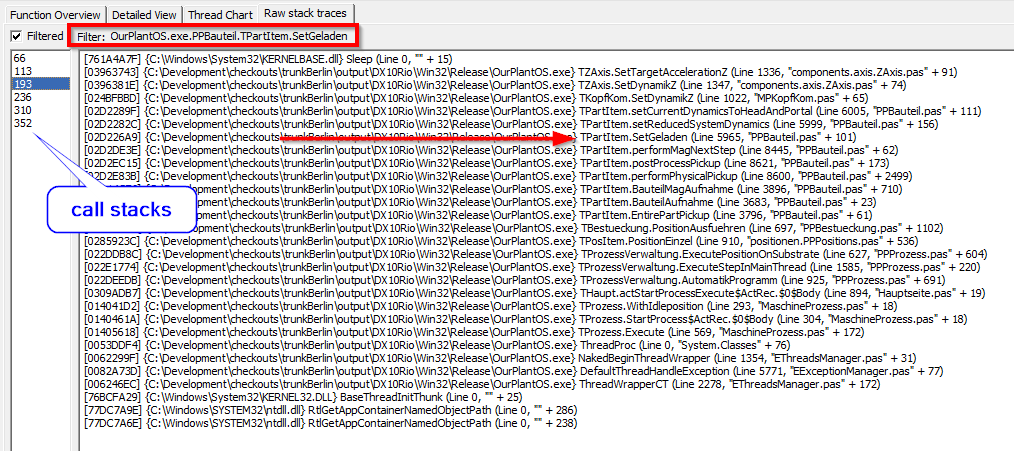
This filter shows the first entry to the selected method. That means in the example the method SetGeladen was called 6 times --> we can see 6 call stacks in the left listbox.
general tab
Here you can find some general information about the capturing session.
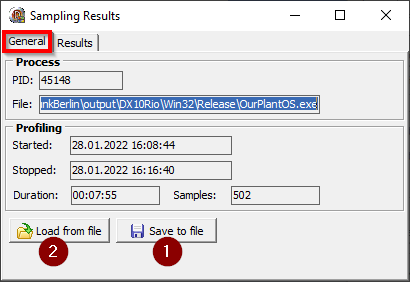
- we also can save a profile run to a file
- and load it on another computer e.g.
this form is also opened when you click in the main form View profiling results